Server Monitoring > Server Monitor
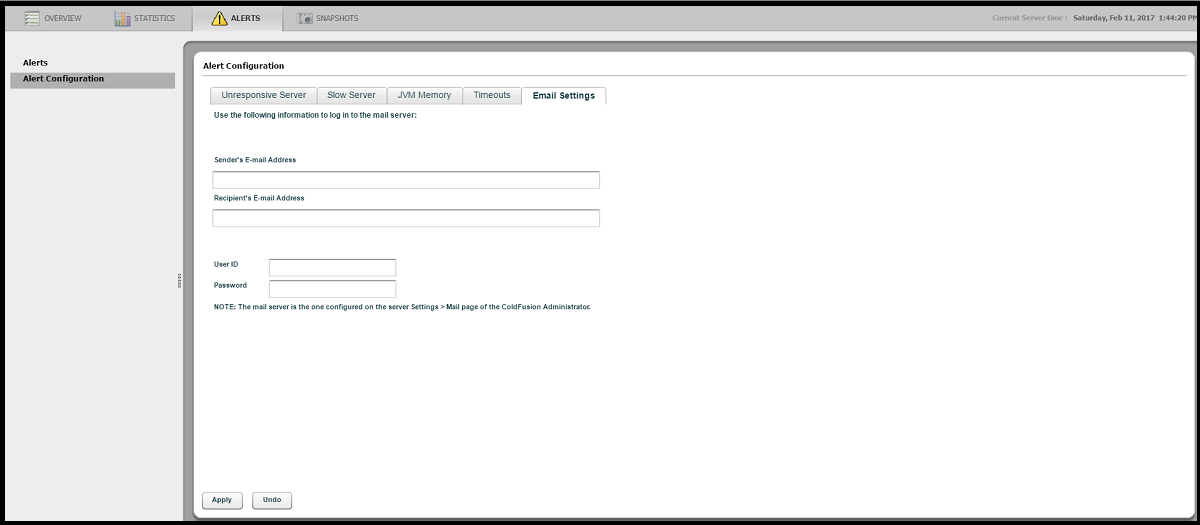
Once Server Monitor is launched from the Server Monitor Settings page, we see this “Overview” screen. This is a real-time view of how your ColdFusion server is performing at this time. The top two segments show Average Response Time and Requests Per Second, respectively. In the middle section we can see on the left “Reports” detailing series of metrics on Requests, Sessions, Queries, and JVM Memory. The middle right area shows Slowest Active Requests. The bottom left shows any Alerts and the bottom right the Last Error.
Statistics
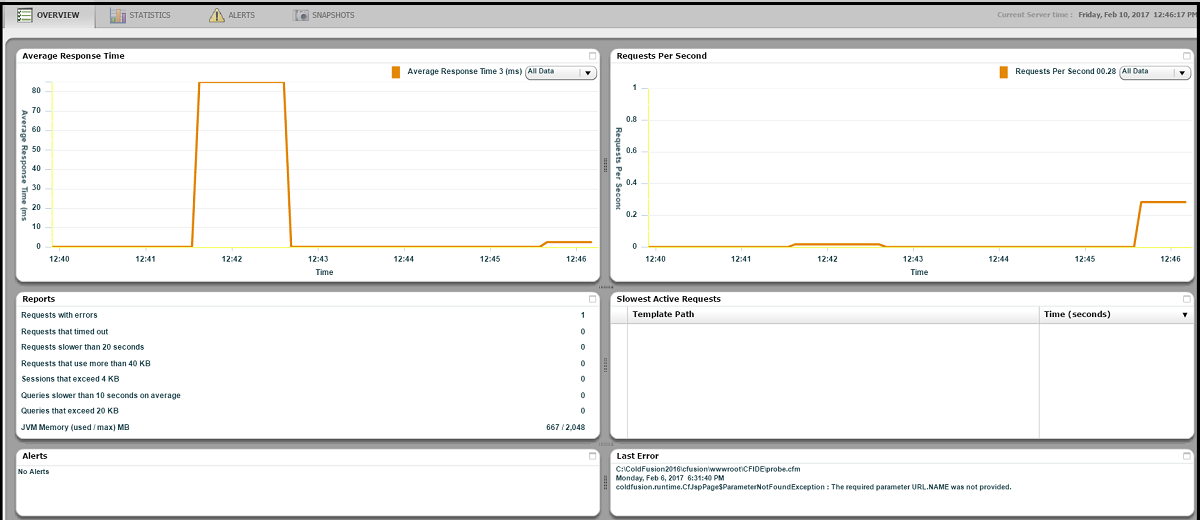
The next section in the Server Monitor is Statistics. We are looking at Active Sessions during a lab load-test. More importantly what this shows us is that the ColdFusion Server Monitor has a tremendous amount of useful information for troubleshooting a server, which we will illustrate.
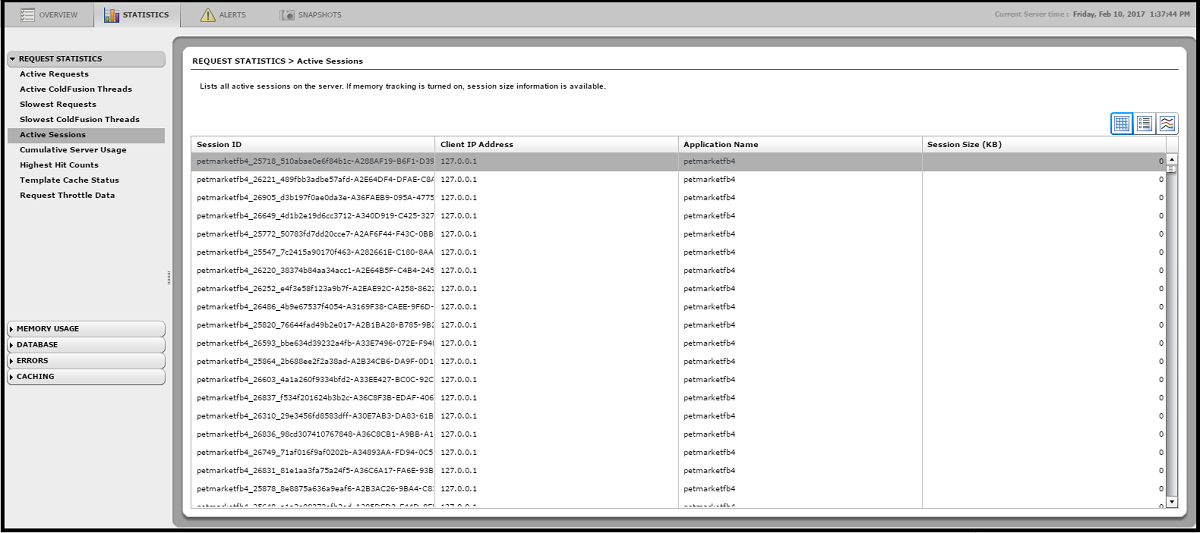
In the same area we see information on Template Cache Status which is an important performance metric, The Template Cache is almost always under-sized and by monitoring this we can optimize that cache.
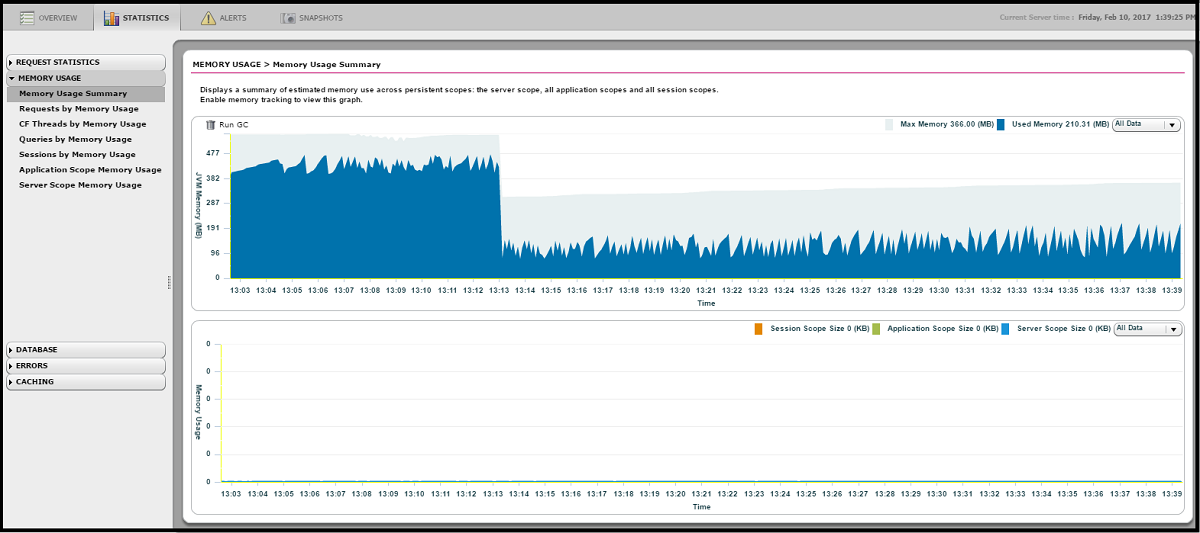
Here we are looking at JVM Heap Memory behavior. We can immediately see the effects of a garbage collection. This sawtooth graph is ideally what we want to see. Memory is collected and does not indicate a leak.
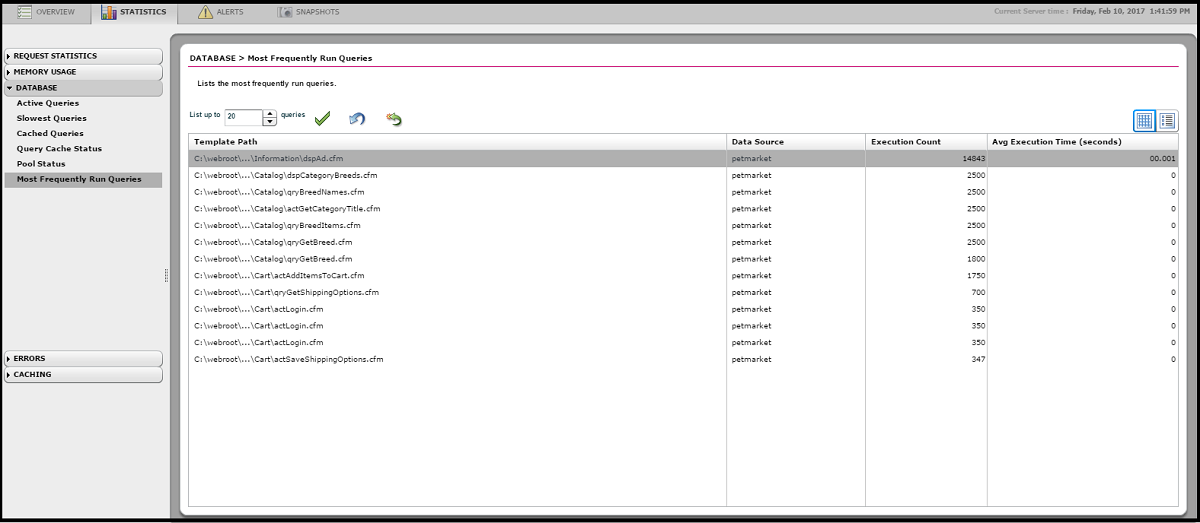
This chart shows the ColdFusion templates running the most queries. This is useful for selecting the most resource intensive templates of the data tier for further investigation.
Alerts
So far we have discussed the real-time capabilities of the Server Monitor. In this section we will show one of the most powerful aspects of the tool, setting up alerts/notifications based on thresholds we will set. This is the Alerts section prior to any alerts being set.

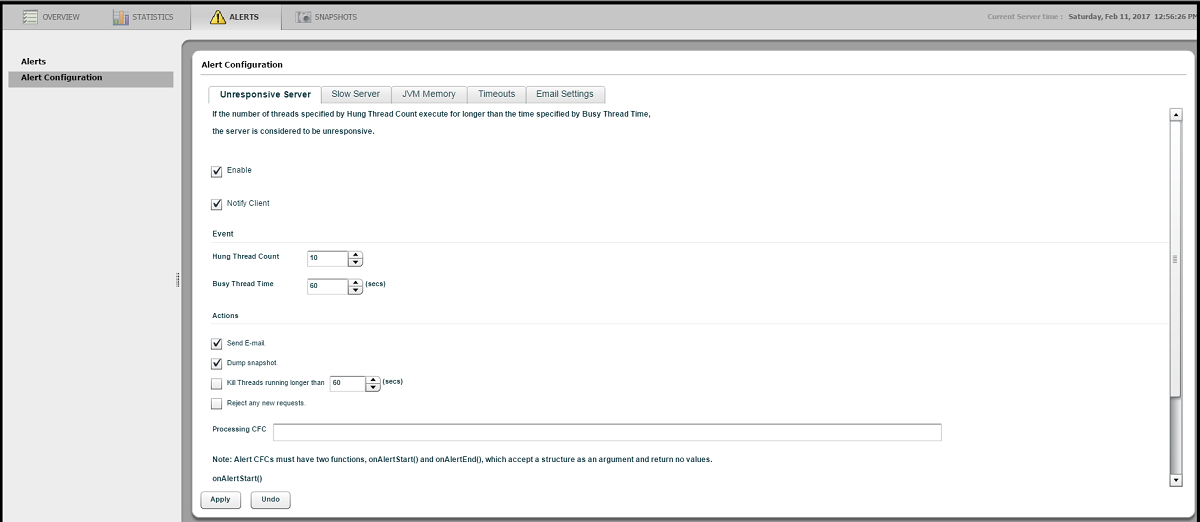
This is the first threshold we are setting and it relates to hanging threads/requests. What we are saying here is if 10 threads are hanging for more than 60 seconds (a long time for so many threads to be hung up) send off an email and dump a very detailed snapshot of the threads at the time of the incident. These dumps are captured in {CF-HOME}/logs/snapshots. We do not advise selecting the Kill Threads checkbox as it is possible to destabilize the server.
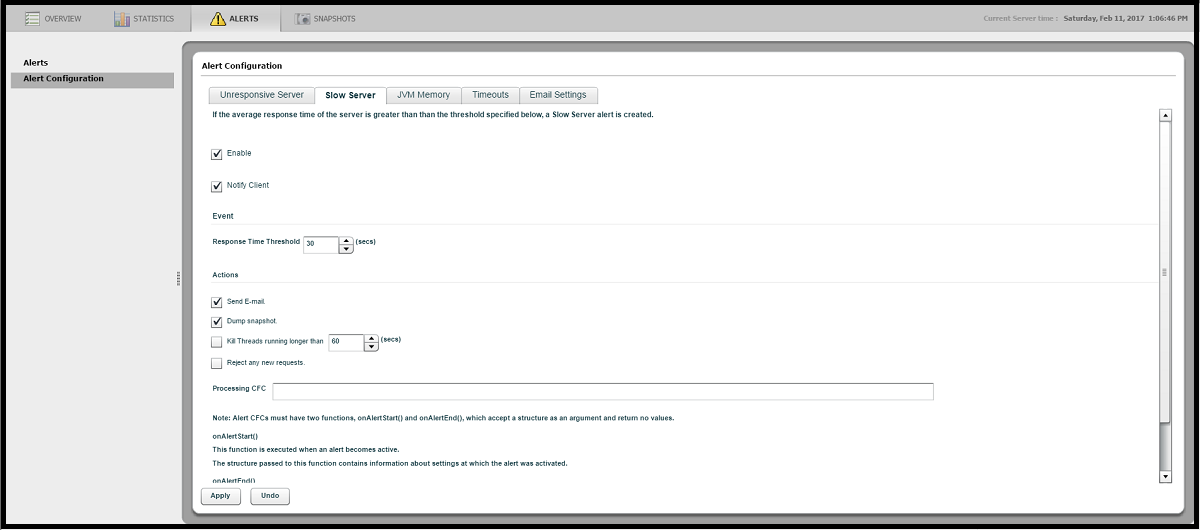
Our configuration here states that if the average server response time is 30 seconds or greater, send an email and dump a detailed snapshot into{CF-HOME}/logs/snapshots. We do not advise selecting the Kill Threads checkbox as that can destabilize the whole server.
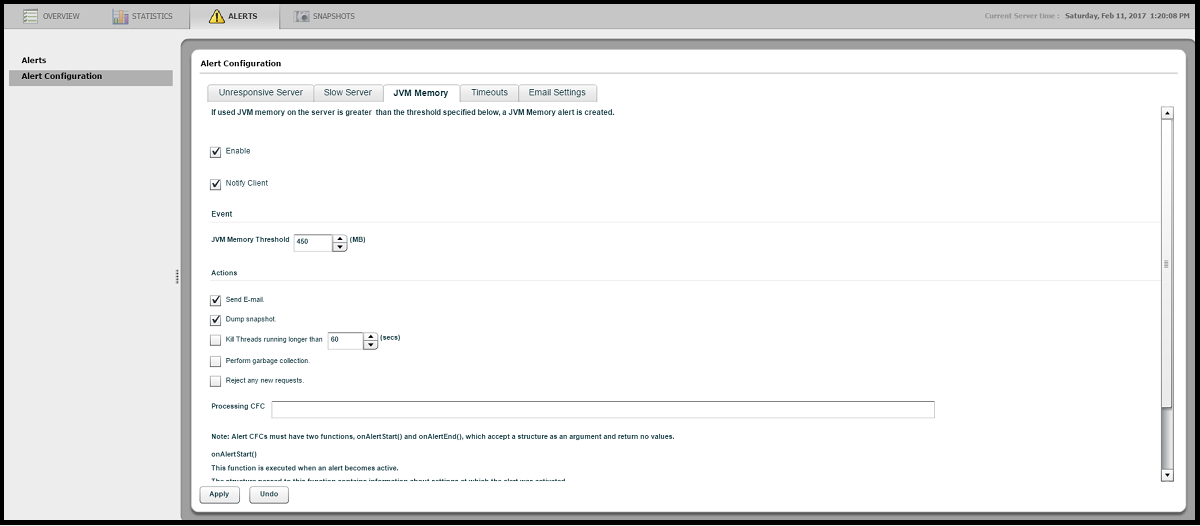
It is also possible to alert on certain conditions involving the JVM memory. This setting is very dependent on the size of the JVM heap. In this case, if the heap usage exceeds 450MB, send an email and dump a detailed snapshot into {CF-HOME}/logs/snapshots. We do not advise selecting the Kill Threads checkbox as that can destabilize the whole server.
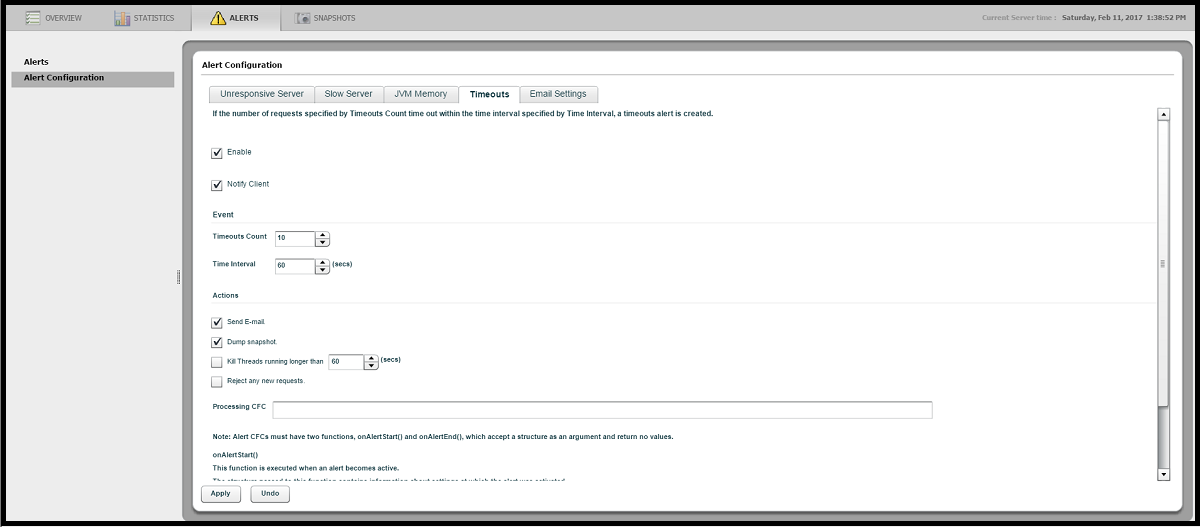
In this configuration we can notify an administrator about page timeouts. The following configuration will trigger an alert if there are 10 or more request timeouts in 60 seconds. We will capture a dump of the threads to {CF-HOME}/logs/snapshots and send an email. We do not advise selecting the Kill Threads checkbox as that can destabilize the whole server.
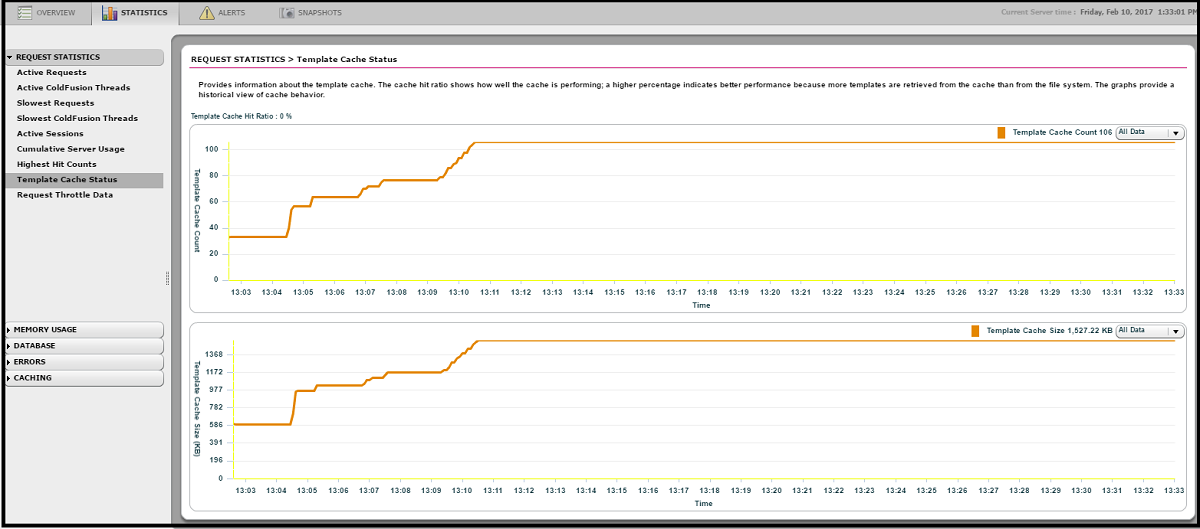
In this section we enter the email details relating to the sending email notifications.
